> ## Documentation Index
> Fetch the complete documentation index at: https://training-docs.cerebras.ai/llms.txt
> Use this file to discover all available pages before exploring further.
# Visualization and Debugging
> Learn how to use our TokenFlow tool to visualize and debug your preprocessed data.
This tool visualizes preprocessed data efficiently and in an organized fashion, allowing for easy debugging and error-catching of the output data. It can handle both text-only and multimodal datasets, visualizing images if available to verify dataset integrity.
TokenFlow supports datasets processed in the following modes - `pretraining`, `finetuning`, `pretraining` with `mlm` and `dpo`.
 ## Using TokenFlow
Run the following command, specifying your file directory:
```bash theme={null}
python3 launch_tokenflow.py --output_dir
```
* `output_dir`: Contains the file(s) that are to be viewed in the GUI. *\[Required]*\* `data_params:` Location of the `data_params.json` file for the preprocessed dataset. *\[Optional]*\* `port:` In case the user wants to specify a different port for the flask server. *\[Optional, default=5000]*
It is assumed that `data_params.json` is present in the same directory as `output_dir`. If not, we expect it to be passed using `--data_params `.
All the `.h5` files pulled from the `output_dir` are displayed in the dropdown, which are loaded when clicked. For each loaded file, all the available sequences are present in the second dropdown, which are also loaded when clicked.
## Visualized Information
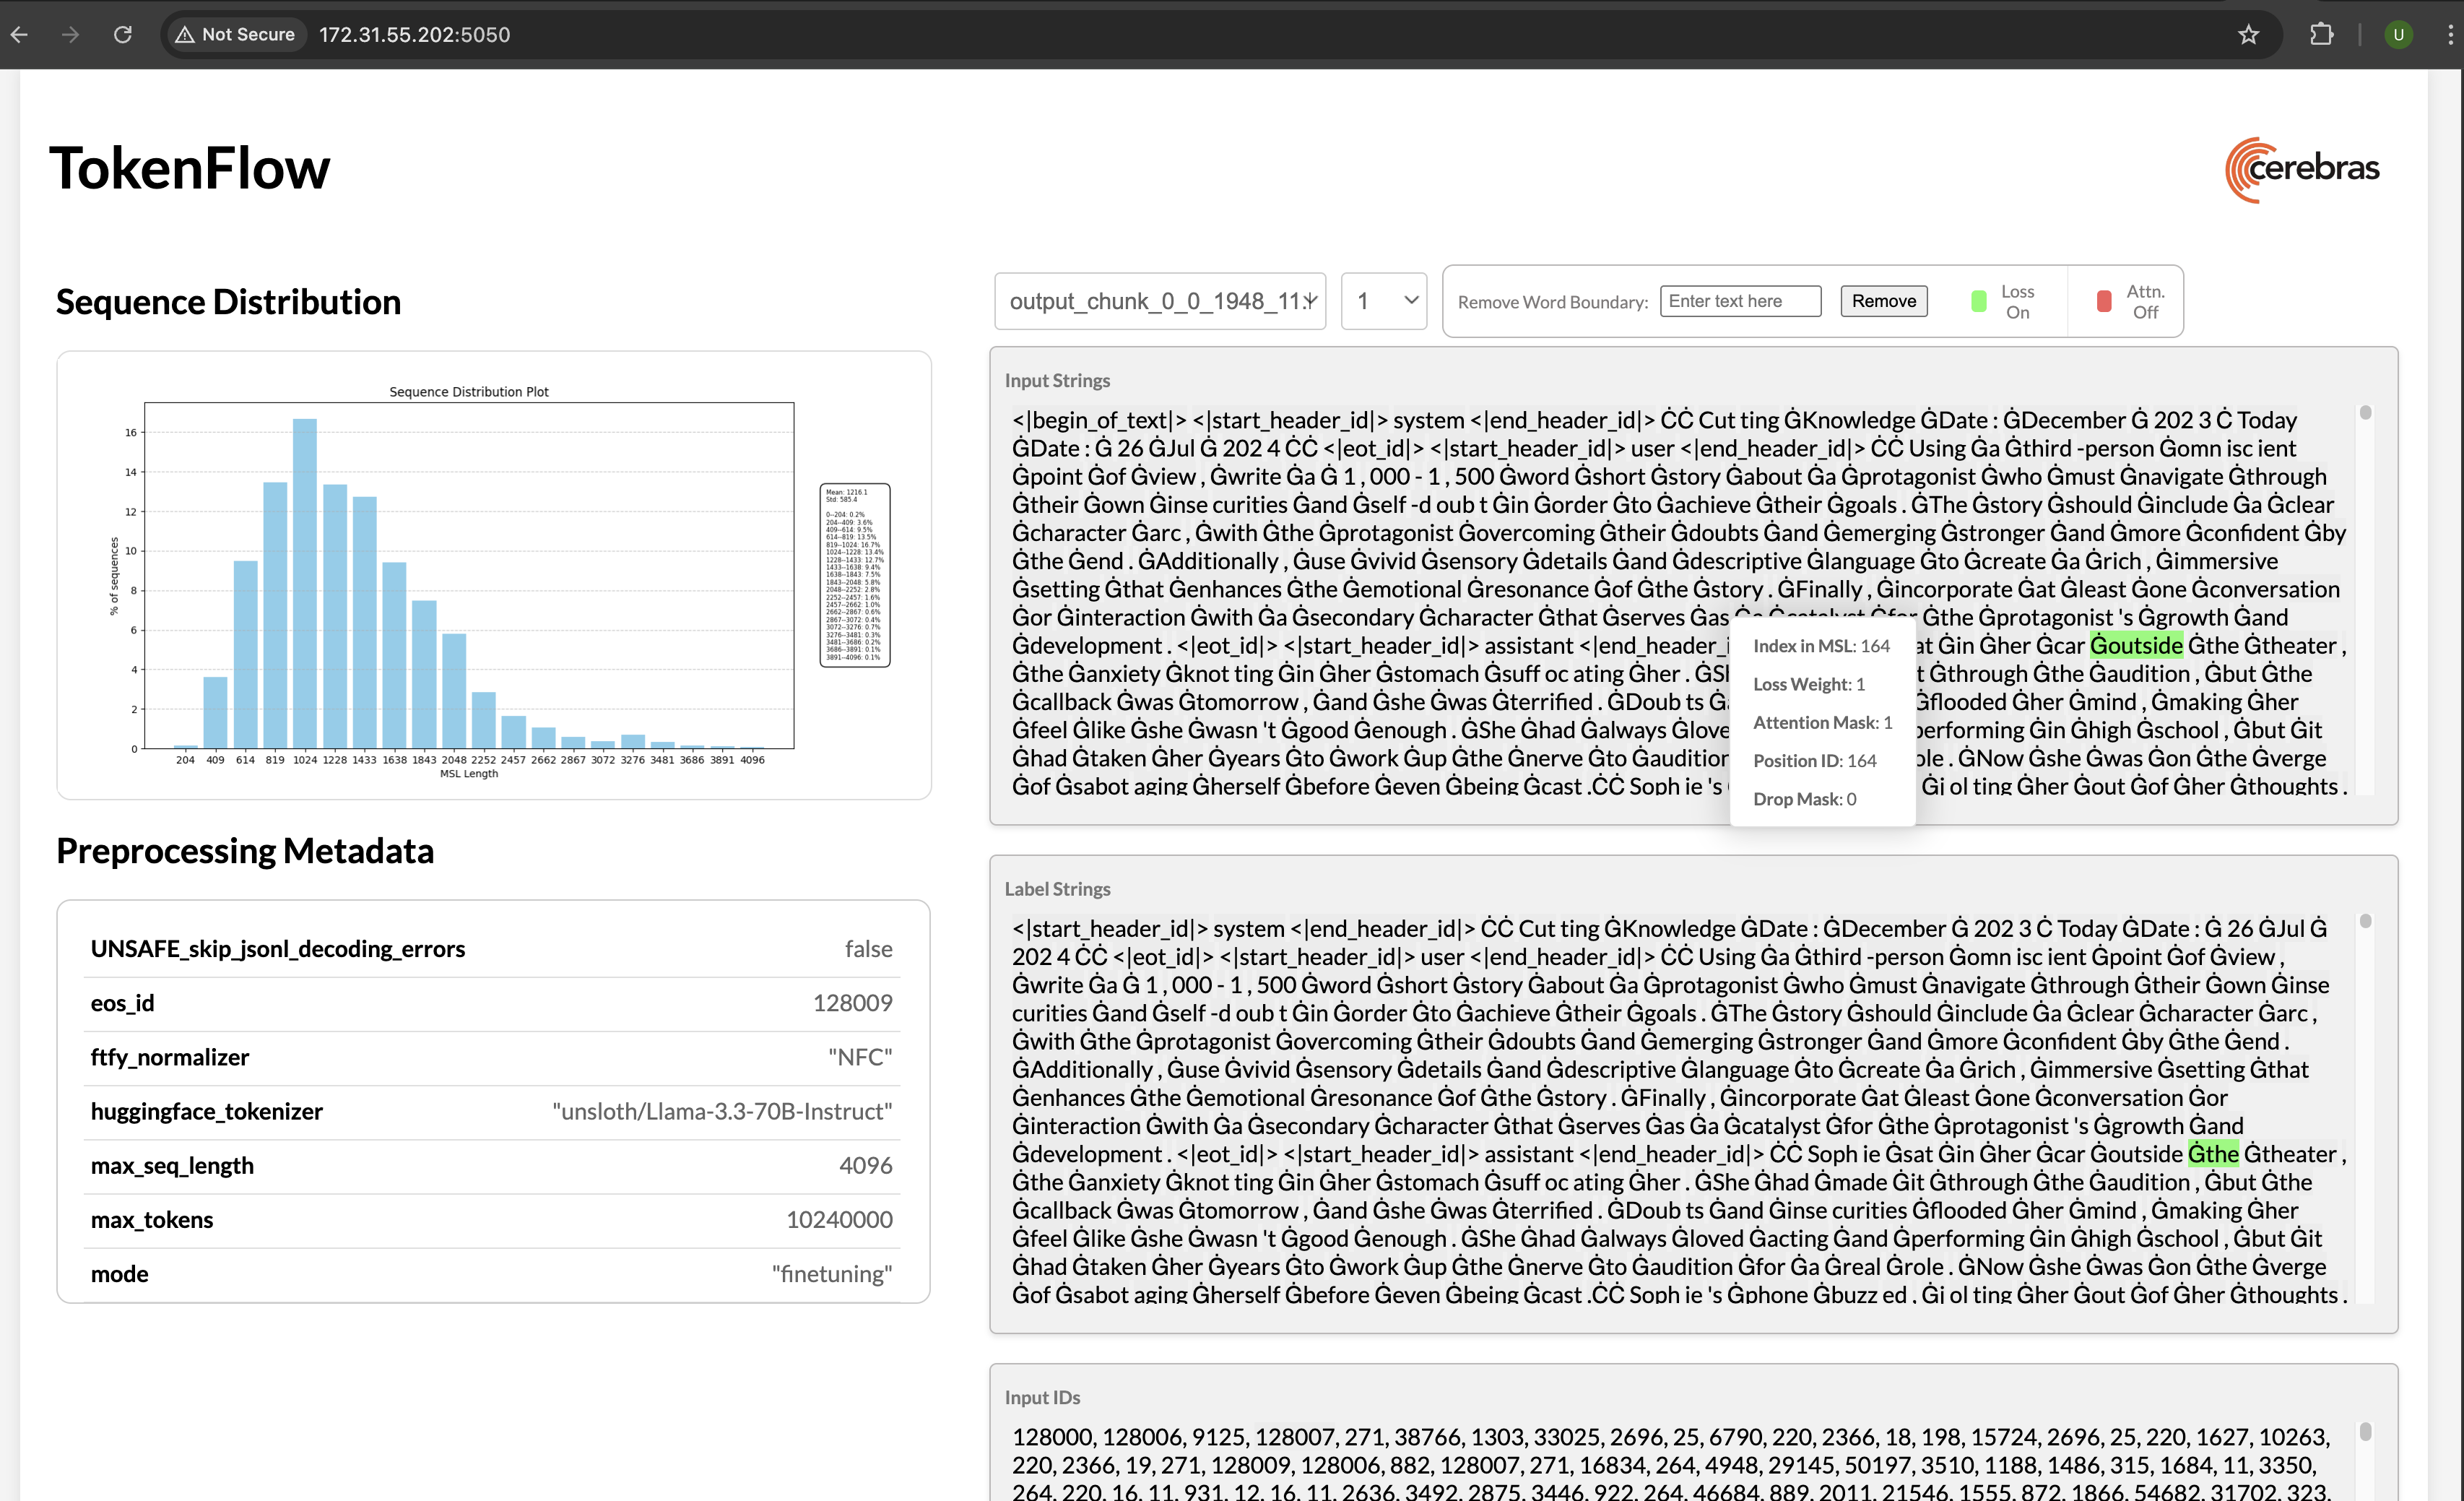
Given the dataset, TokenFlow displays the associated metadata, present in `data_params.json`, in the left column of the page. It also displays the distribution of sequence lengths that are present in the dataset, across the `.h5` files.
On the right column, there are 4 sections. `input_strings` and `label_strings` are converted tokens from `input_ids` and `labels` respectively. The tokens in the string sections are highlighted in green when loss weight is greater than zero for that specific token. Similarly, the tokens are highlighted in red when their Attention mask is set to zero.
Hovering over any token in all 4 sections highlights their corresponding token in all the other sections. This helps in checking if the mapping of an id to token, or an input to its label is correct.
Additionally, the hover opens up a popup. which displays additional information like the Position IDs and the token’s idx in MSL. Also, in the case of a multimodal dataset, hovering over the image pad tokens also displays the corresponding image in the popup itself.
For datasets processed in the DPO mode, the sequence selector dropdown shows sequences from the 'Chosen' section and the 'Rejected' section separately -- the format is `` or ``, where C stands for Chosen and R stands for Rejected.
## Using TokenFlow
Run the following command, specifying your file directory:
```bash theme={null}
python3 launch_tokenflow.py --output_dir
```
* `output_dir`: Contains the file(s) that are to be viewed in the GUI. *\[Required]*\* `data_params:` Location of the `data_params.json` file for the preprocessed dataset. *\[Optional]*\* `port:` In case the user wants to specify a different port for the flask server. *\[Optional, default=5000]*
It is assumed that `data_params.json` is present in the same directory as `output_dir`. If not, we expect it to be passed using `--data_params `.
All the `.h5` files pulled from the `output_dir` are displayed in the dropdown, which are loaded when clicked. For each loaded file, all the available sequences are present in the second dropdown, which are also loaded when clicked.
## Visualized Information
Given the dataset, TokenFlow displays the associated metadata, present in `data_params.json`, in the left column of the page. It also displays the distribution of sequence lengths that are present in the dataset, across the `.h5` files.
On the right column, there are 4 sections. `input_strings` and `label_strings` are converted tokens from `input_ids` and `labels` respectively. The tokens in the string sections are highlighted in green when loss weight is greater than zero for that specific token. Similarly, the tokens are highlighted in red when their Attention mask is set to zero.
Hovering over any token in all 4 sections highlights their corresponding token in all the other sections. This helps in checking if the mapping of an id to token, or an input to its label is correct.
Additionally, the hover opens up a popup. which displays additional information like the Position IDs and the token’s idx in MSL. Also, in the case of a multimodal dataset, hovering over the image pad tokens also displays the corresponding image in the popup itself.
For datasets processed in the DPO mode, the sequence selector dropdown shows sequences from the 'Chosen' section and the 'Rejected' section separately -- the format is `` or ``, where C stands for Chosen and R stands for Rejected.